
It has been a tumultuous second quarter so far. After only nine trading days, we have seen U.S. stocks as measured by the S&P 500 plunge by more than -15% peak-to-trough in the wake of the “Liberation Day” tariff announcements, only to find their footing and battle their way back since. Although the tariffs for most countries have been paused for 90 days, market volatility remains elevated and investors on edge. What is the set up for capital markets for the week ahead? And what are the implications for the longer term outlook.
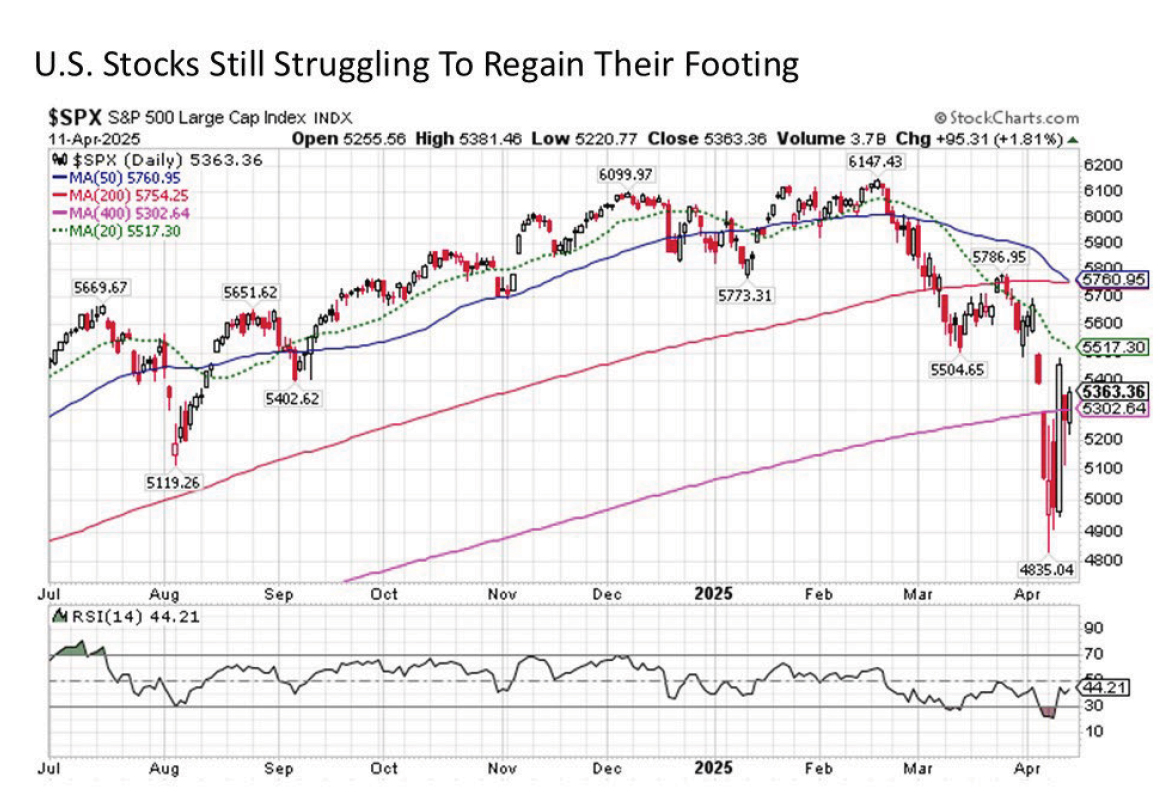
The technical battle lines have been set for the U.S. stock market as measured by the S&P 500. The current cycle low is in at 4835 as shown in the chart above. Why is this important? Because stocks in the midst of a correction will often retest a short-term low before setting a final bottom and pushing their way higher. We are already trading +11% above this low set at the open last Monday, which is constructive. And it is conceivable that stocks may forgo retesting this low before it’s all said and done. This is due to the fact that the S&P 500 has reclaimed its ultra long-term 400-day moving average (pink line in chart above) after thrashing back and forth over a wild five day stretch last week. Thus, the key support level to watch in the coming days is 5302 and rising on the 400-day moving average. Although the Relative Strength Index (RSI) is now well off of deeply oversold levels at 44.21, it still has room to the upside before hitting the bull/bear crossover line at 50. For technical analysis fans out there, an advance in the S&P 500 that pushes the RSI above 50 would be a particularly constructive development for further gains in the days ahead.
What about the technical obstacles to the upside in the days ahead? Another constructive point for the S&P 500 is that despite the recently strong bounce, considerable room still exists to the upside before the S&P 500 reaches its downward sloping 20-day moving average (dashed green line in the chart above) currently at 5517 and falling. This implies that stocks have open space for another +2% to +3% advance before running into resistance. And if they can advance assertively above this short-term 20-day moving average resistance dating back effectively to late February, the next key levels to watch are both the 50-day and 200-day MAs currently in the 5750 to 5760 range, which is more than +7% above current levels. Assuming that the worst is almost certainly already in for the short-term tariff news at least for now, the bias remains to the upside for U.S. stocks in the holiday shortened trading week ahead (the markets are closed on Friday for Good Friday).
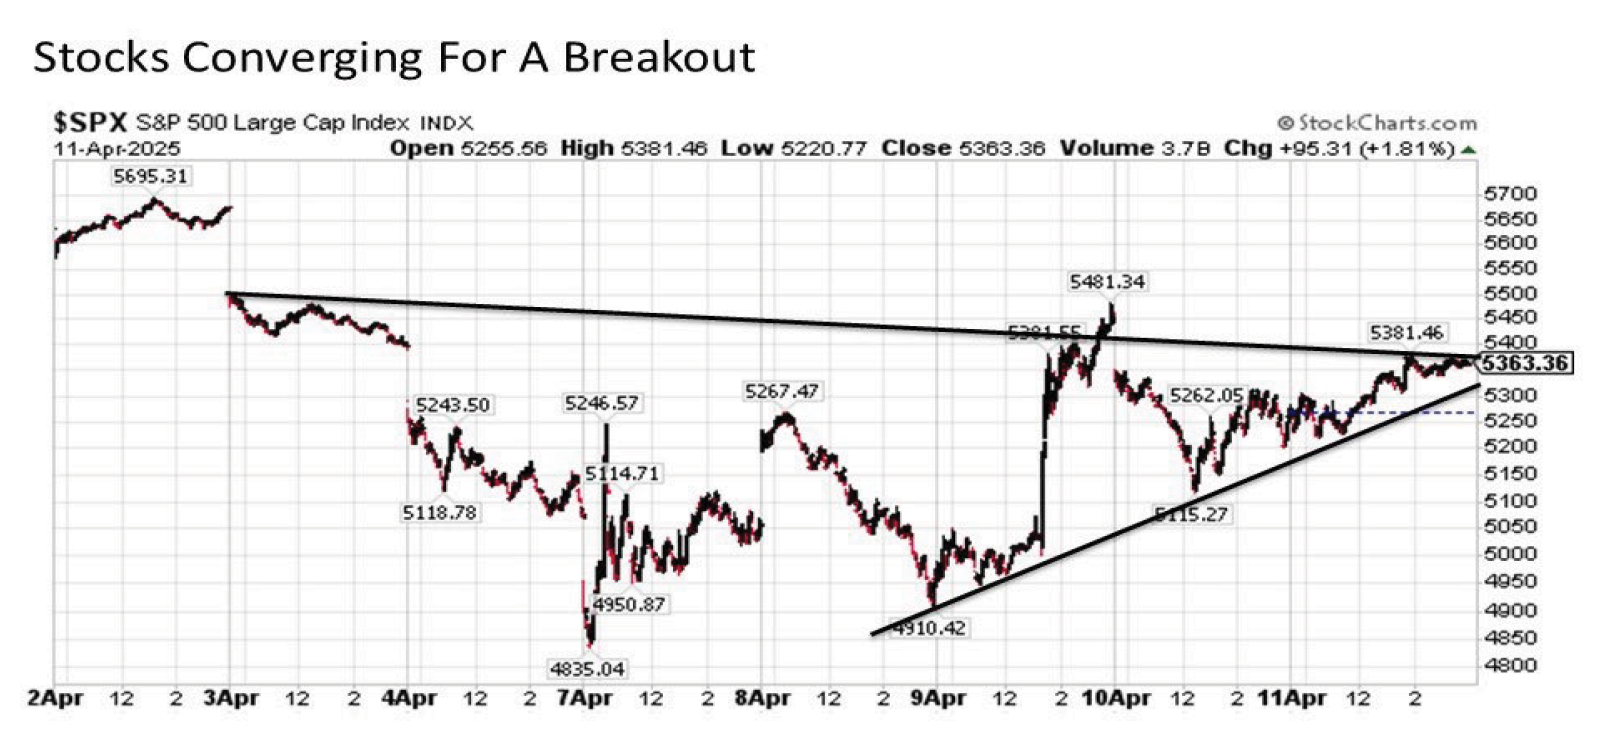
Looking closer at the intraday charts on the S&P 500 provides further support for the short-term upside breakout thesis. Focusing on the intraday trading channel dating back to April 8 in particular (before the 90-day pause was announced), we see that stocks have been picking up momentum with notably higher lows versus only the marginal lower highs dating all the way back to April 3. This implies that buyers are advancing far more assertively in recent trading days since sellers are likely to seek to defend in the coming trading days. And with futures already trading solidly higher heading into the overnight into Monday’s trading, an intraday breakout appears in the cards and is a bullish way to kick off the new trading week.
So the short-term technical set up is positive, but what about the latest on the fundamentals. After all, the economic and financial implications associated with the recent tariff announcements have been jarring to say the least.
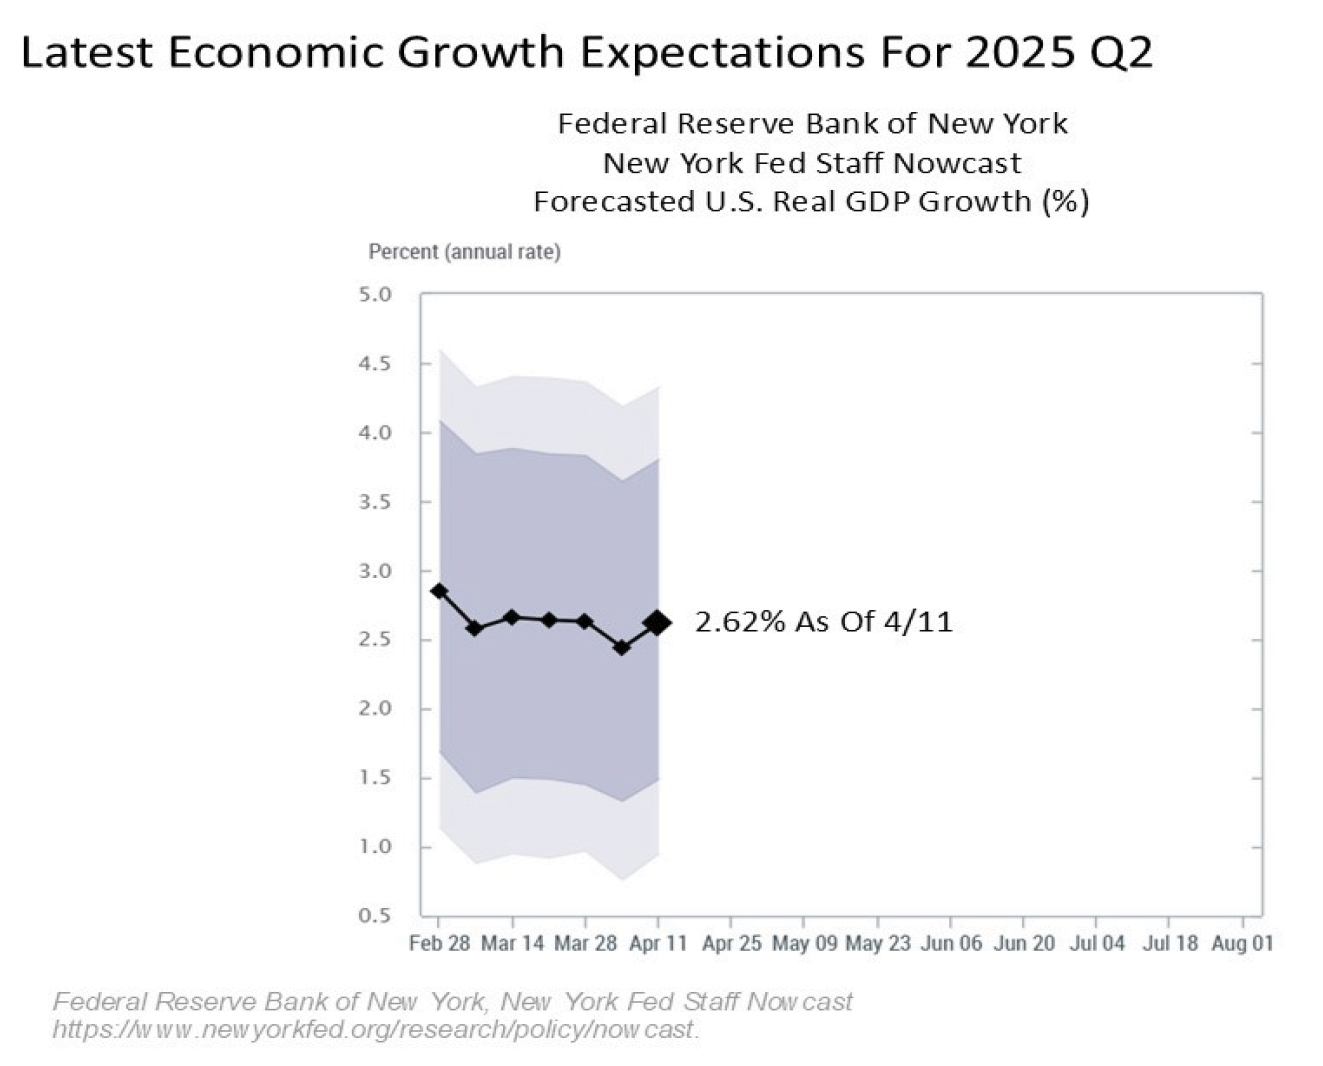
Let’s begin with the latest look at the economic forecasts. For this, we will focus on the latest readings for U.S. GDP growth for 2025 Q2 from the New York Fed Nowcast, which will be the quarter that will start to incorporate the full brunt of the tariffs as they are implemented. While it remains early in the data cycle, the latest forecast for GDP growth for the current quarter is 2.6% as of Friday, April 11. While this number could still change quite a bit over the coming months, this latest reading remains rock solid.
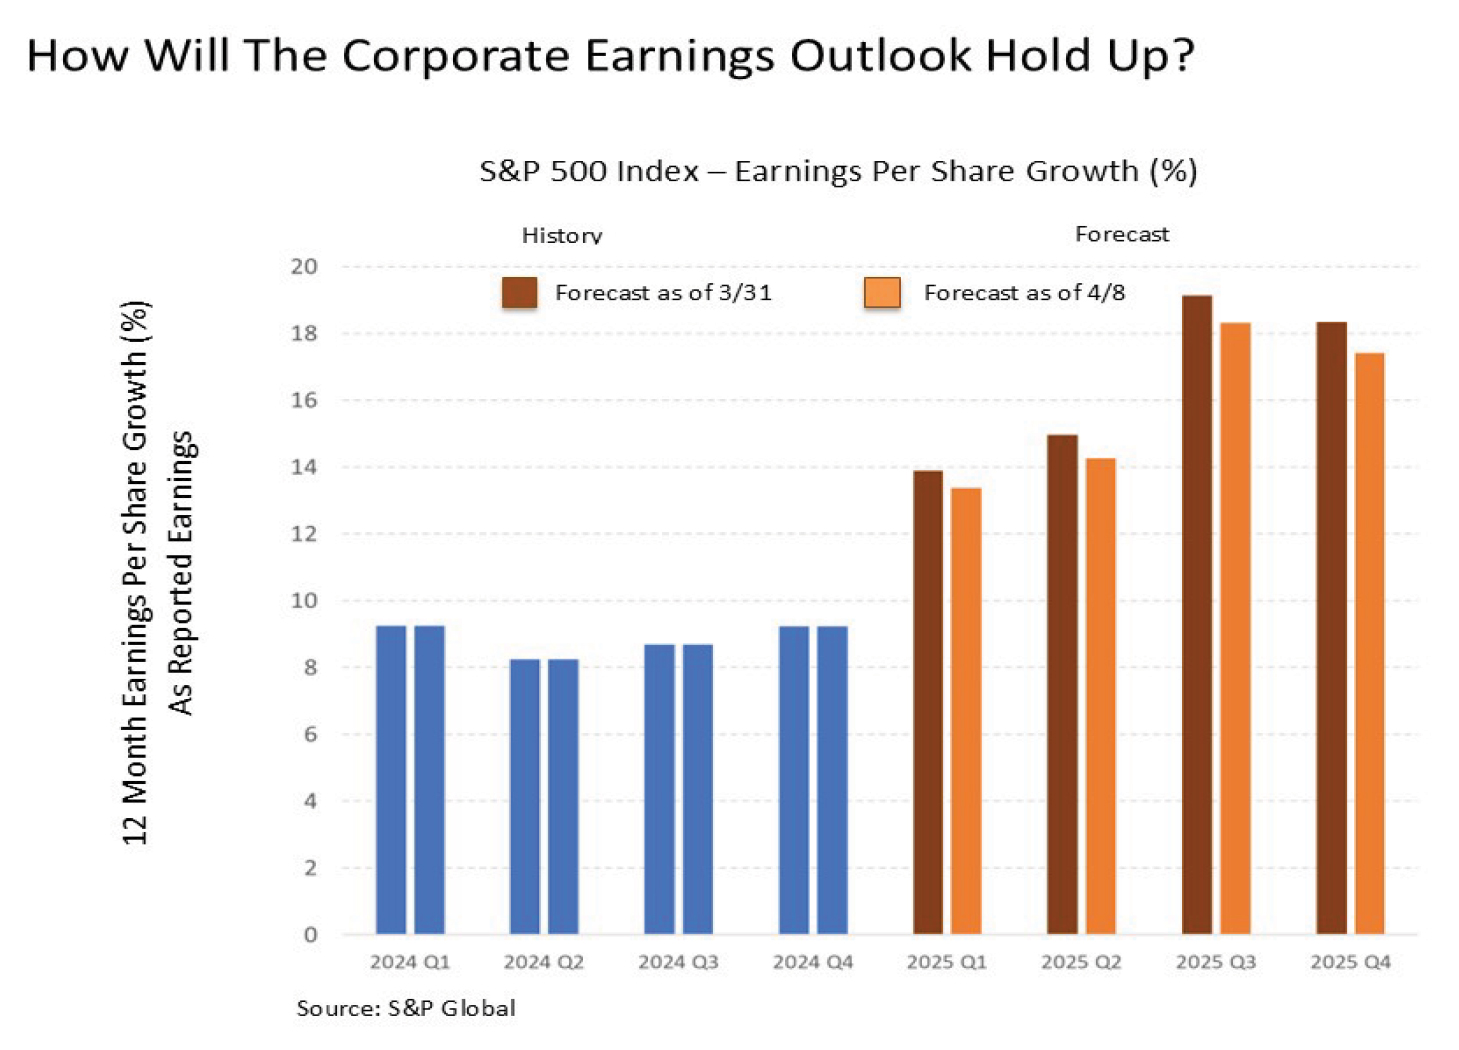
What about the latest on corporate earnings, which are driven by GDP growth and are a primary determinant of stock market returns? The latest forecast is in through April 8 with the first few companies having reported their earnings and their outlook. We have already seen some deterioration in the earnings forecast for the remainder of 2025, which is expected, but nonetheless the earnings forecast remains robust. How much of this collective expected earnings growth the S&P 500 will be able to sustain in the coming weeks remains to be seen, but the good news remains that we are starting from a high bar.
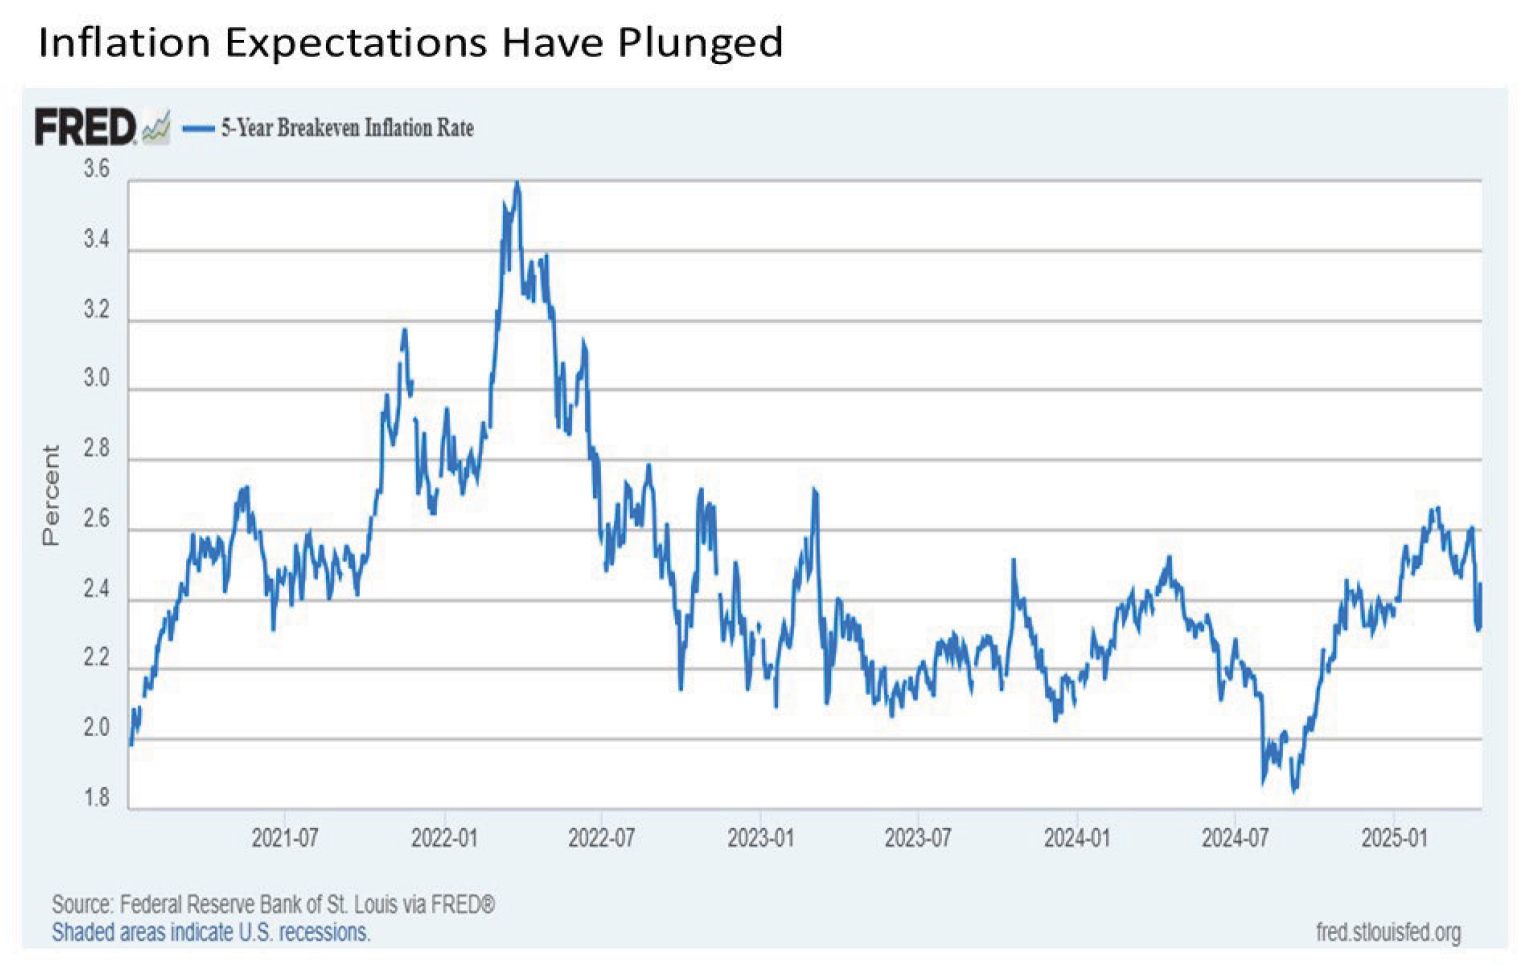
Arguably just as important is the inflation outlook, particularly since tariffs are widely and rightfully regarded as inflationary. Despite all of the headlines about “inflation” and “stagflation”, the market continues to price in a decidedly different outlook on the inflation front. After ending last quarter at 2.61%, the 5-year breakeven inflation rate that measures expected average inflation over the next five years has plunged in the wake of the tariff announcements and have remained low at 2.33% through Friday. Put simply, a near 30 bps drop in five-year inflation expectations signals a market much more worried on the margins about disinflationary/deflationary economic recession in the second half of 2025, not looming inflation or stagflation. And this implies continued flexibility for a potential Fed surprise of more accommodative monetary policy in the form of interest rate cuts in the months ahead. The market is already pricing in a quarter point rate cut by June and three quarter point cuts by December.
Putting this all together, the fundamental and technical backdrop for stocks remains constructive as the new trading week gets underway. The political and financial news flow remains relentless and unpredictable, however, so the market remains well served to be braced for what latest breaking news headline might jar capital markets. Nonetheless, volatility as measured by the CBOE Volatility Index, or the VIX, continues to slowly drift in the right direction from their April 8 peaks at over 57 to 37 by the end of last week. Watch for a move in the VIX back below 30 in the early part of the trading week, which would signal that the worst may be behind the stock market at least in the short-term.
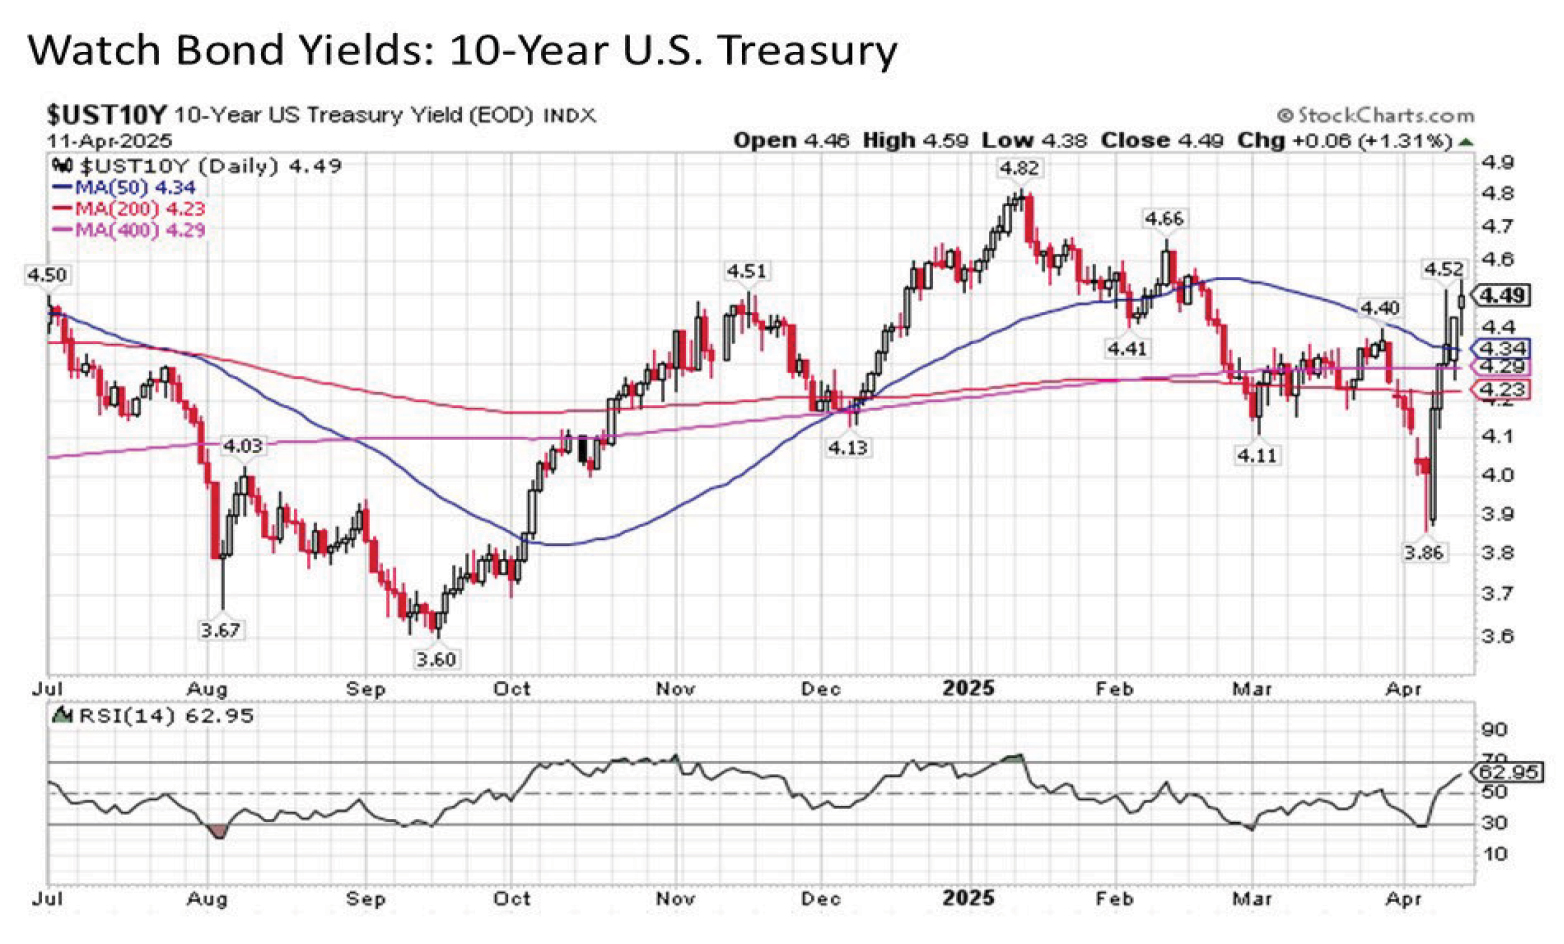
Of course, the arguably more important story that merits watching not only for the short-term but for the intermediate-term and long-term through the remainder of the year and beyond is the bond market. After all, it was the dramatic surge in Treasury yields including the 10-Year from below 3.9% during the overnight heading into Monday’s trading last week to over 4.5% by Wednesday coupled with the precipitous drop in the U.S. dollar was the very likely catalyst for the 90-day pause (forget about trade wars – a swift capital flight out of the U.S. evaporating Treasury market liquidity while sending borrowing costs soaring and the dollar precipitously declining is an effective way to tame the U.S. tariff impulse really fast). Yields moved relentlessly and sharply higher all last week, and it will be important to watch to see if this recent surge starts to level out to start the new trading week.
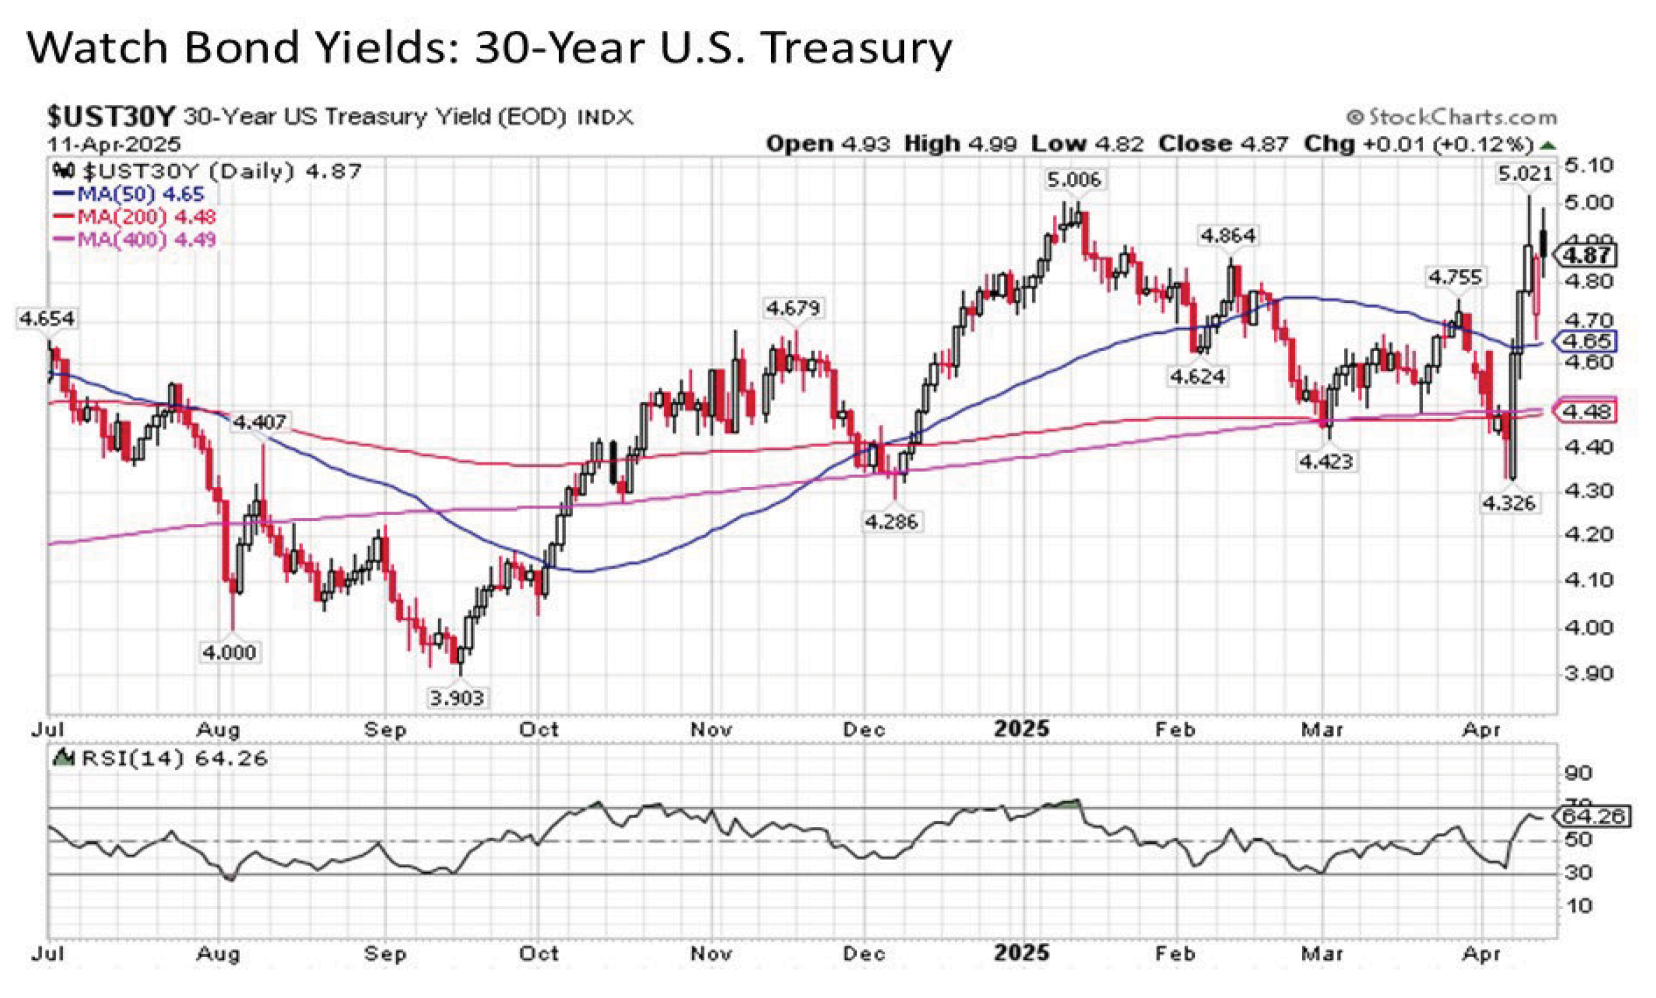
The look on the 30-Year U.S. Treasury is even worse, as yields punched new highs for 2025 at just over 5% during the weekly surge.
Why does this surge in bond yields and the associated decline in the U.S. dollar matter? Because the U.S. has been the almost exclusive destination for global capital dating back to the beginning of last decade in the immediate aftermath of the Great Financial Crisis. This has powered the U.S. bias that has benefited so many domestic investors for so many years. The U.S. has not made any new friends with the global community with the ongoing tariff drumbeat, and these moves in bond yields and the dollar are signaling that the rest of the world may be pulling up stakes and moving out of the U.S. in a meaningful way. Perhaps this is a fleeting development and everyone will settle back down into business as usual. But if these trends continue in the weeks and months ahead, it not only potentially increasingly puts the U.S. economy and its financial markets into a bind as the year progresses, but it may ultimately result in the manifestation of the long anticipated rotation out of overvalued U.S. stocks and into relatively undervalued developed international and (selected) emerging markets. Stay tuned.
The new trading week appears to be getting off to a good start. Keep an eye on the financial headlines in the days ahead.
Disclosure: I/we have no stock, option or similar derivative position in any of the companies mentioned, and no plans to initiate any such positions within the next 72 hours. I wrote this article myself, and it expresses my own opinions. I am not receiving compensation for it. I have no business relationship with any company whose stock is mentioned in this article.
Investment advice offered through Great Valley Advisor Group (GVA), a Registered Investment Advisor. I am solely an investment advisor representative of Great Valley Advisor Group, and not affiliated with LPL Financial. Any opinions or views expressed by me are not those of LPL Financial. This is not intended to be used as tax or legal advice. All performance referenced is historical and is no guarantee of future results. All indices are unmanaged and may not be invested into directly. Please consult a tax or legal professional for specific information and advice.
LPL Compliance Tracking #: 725181
